The BCG matrix of Nike maps its entire product portfolio across four quadrants, including Stars, Cash Cows, Question Marks, and Dogs. These quadrants are based on market growth rate and relative market share. Understanding where each Nike product line sits in the growth-share matrix reveals exactly where the brand invests, where it harvests profits, and where it faces hard strategic decisions.
What Is the BCG Matrix?
The BCG matrix, formally called the Boston Consulting Group growth-share matrix, is a strategic portfolio management tool developed by BCG founder Bruce Henderson in 1970. It plots a company’s products on a 2×2 grid using two variables:
- Market growth rate (vertical axis): How fast is the market for this product growing?
- Relative market share (horizontal axis): How does the product’s market share compare to its largest competitor?
The result is four quadrants:
- Stars — High growth, high market share. Require investment but generate strong returns.
- Cash Cows — Low growth, high market share. Generate steady cash with minimal investment.
- Question Marks — High growth, low market share. Uncertain potential; requires strategic decisions.
- Dogs — Low growth, low market share. Minimal contribution; often candidates for divestment.
Applied to Nike, the BCG matrix is not just a classroom exercise. It’s a working lens for understanding one of the most complex product portfolios in consumer goods; a $46+ billion company that sells everything from Air Jordan 1s to skateboarding shoes to Converse Chuck Taylors.
Nike: Company Overview
Nike, Inc. was founded in 1964 as Blue Ribbon Sports by Phil Knight and Bill Bowerman in Portland, Oregon. The Nike brand itself was introduced in 1971. The company went public in 1980 and has since become the world’s largest athletic footwear and apparel manufacturer.
Today, Nike sells products across more than 190 countries through owned retail stores, digital platforms, and a network of wholesale partners. Its portfolio spans three primary brands: Nike, Jordan, and Converse.
| Stat #1: Nike holds an estimated 27–30% share of the global athletic footwear market — more than double its nearest competitor, Adidas, which holds approximately 11%. (360 Research Reports / Brand Finance, 2025) Stat #2: In fiscal year 2024 (ending May 31, 2024), Nike reported total revenues of $51.4 billion, with footwear alone accounting for 68% of that total — roughly $33 billion in footwear sales — Statista, 2024. |
With a product portfolio spanning performance running shoes, lifestyle sneakers, basketball footwear, sportswear apparel, equipment, accessories, and Converse, a BCG matrix analysis is essential for understanding what actually drives Nike’s business.
The BCG Matrix of Nike: Four Quadrants Explained
1. Stars — High Growth, High Market Share
Stars are a company’s high performers. They generate strong revenue and command a leading position in a growing market. They typically require continued investment to maintain momentum.
For Nike, the clear Stars are its performance and lifestyle footwear lines, particularly Nike running shoes and the Jordan Brand.
a. Nike Running Shoes (Air Max, React, VaporMax, Pegasus)
Nike’s running footwear segment is its single largest revenue driver. The category benefits from two powerful tailwinds: rising global health awareness, increasing demand for performance footwear, and Nike’s continuous innovation, keeping it ahead of competitors.
The Air Max, React, and VaporMax lines maintain strong brand relevance among both serious runners and casual consumers who wear performance shoes for lifestyle purposes.
Nike’s ongoing investment in cushioning technology, sustainability features, and limited-edition colorway drops keeps demand elevated. Footwear accounted for 68% of Nike’s total revenues in fiscal 2024, with running shoes leading the category.
Nike’s running segment recovery has been notable. As of fiscal 2026 Q2, Nike Brand running was up over 20% year-over-year and actively taking market share from rivals, one of the brand’s clearest signs of competitive health.
b. Jordan Brand
The Jordan Brand deserves special mention in any BCG matrix of Nike. It straddles the line between Star and Cash Cow depending on the period, but in terms of cultural relevance and growth trajectory over the past five years, it belongs firmly in the Star quadrant.
Jordan Brand revenue doubled between 2020 and 2024, expanding beyond basketball into women’s apparel, lifestyle footwear, and international markets. Jordan Brand reached $7 billion in sales in fiscal year 2024, a 6% gain that year and a revenue figure that had more than doubled since 2019.
| Jordan Brand generated $7.3 billion in revenue in fiscal year 2024 (ending May 2024), representing approximately 13% of Nike’s total consolidated revenue. It had grown at a compound annual growth rate of over 17% between 2020 and 2024. (Sportico, June 2024) |
Note: Fiscal year 2025 (ending May 2025) saw Jordan Brand revenue decline 16% to $7.3 billion as Nike pursued a broader strategic reset. This is discussed further in the context of the BCG framework’s dynamic nature.
c. Nike Sportswear (NSW)
Nike’s sportswear category, athleisure, lifestyle sneakers, and branded apparel occupy a high-growth, high-share position. The category benefits from the long-running shift toward casual, athletic-inspired dressing. NSW generated approximately $8.9 billion in revenue in fiscal year 2023, commanding a substantial share of the casual athletic wear market.
2. Cash Cows — Low Growth, High Market Share
Cash Cows are the dependable revenue engines. The market isn’t growing fast, but the product commands a dominant share and generates a consistent cash flow that funds the rest of the business.
a. Nike Equipment and Accessories
Nike’s equipment and accessories segment, including sports bags, socks, protective gear, and branded accessories, is the textbook definition of a Cash Cow. Approximately 4% of Nike’s total revenue comes from equipment and accessories, a figure that’s stable but not rapidly growing.
The market is mature and competitive. Nike doesn’t need to innovate aggressively here. Instead, it leverages its brand equity and celebrity endorsement partnerships to maintain market presence. The strategy works: these products generate predictable margins with relatively low investment requirements.
b. Nike Apparel
Apparel is Nike’s second-largest revenue category, accounting for approximately 29% of total revenue in fiscal 2025. The apparel market for athletic and lifestyle wear is growing, but Nike’s relative share growth in this category is slower than in footwear. Established product lines like training shorts, performance tops, and Pro compression gear generate steady, reliable revenue without requiring heavy innovation investment.
Nike uses apparel as a brand reinforcement tool rather than a growth driver. Celebrity partnerships, team kit deals (FC Barcelona, Paris Saint-Germain, Chelsea), and athlete endorsements keep the apparel category visible without requiring massive R&D spend.
c. Nike Basketball Footwear (Excluding Jordan)
Nike’s core basketball shoe line, distinct from Jordan Brand, occupies Cash Cow territory. The performance basketball shoe market has declined over the past decade as the market has shifted toward retro/lifestyle basketball styles. But Nike’s brand equity in this space, built over decades of NBA endorsements, keeps it generating reliable revenue.
| In fiscal year 2025, Nike’s footwear segment accounted for approximately 66% of Nike’s total $46.3 billion in revenue, with apparel contributing 29% and equipment 5%. (Nike Investor Relations / Macrotrends, 2025) |
3. Question Marks — High Growth, Low Market Share
Question Marks sit in high-growth markets but haven’t secured a dominant position yet. They require strategic investment and deliberate choices: either invest to build them into Stars, or exit.
a. Converse
Converse is the most discussed and debated position in the BCG matrix of Nike. Nike acquired Converse in 2003 for $305 million. For years, Converse performed solidly, peaking at $2.4 billion in revenue in fiscal 2023.
But the trajectory since then tells a different story. Converse has faced consecutive years of sharp revenue decline, driven by over-reliance on the Chuck Taylor All Star and failed attempts to diversify into new styles.
- Fiscal 2024: Converse revenue fell 14% to $2.1 billion (Nike Investor Relations, 2024)
- Fiscal 2025: Converse revenue fell a further 19% to $1.7 billion (Nike Investor Relations, 2025)
- Q2 Fiscal 2026: Converse revenue fell 30% year-over-year to $300 million, with the brand swinging to an operating loss (Fintool, February 2026)
| At Converse’s current revenue run rate, the brand is heading toward approximately $1.2 billion in annual revenue — its lowest level since before fiscal 2018, when it generated $1.89 billion. The problem is structural: the brand remains “heavily reliant on its Chuck Taylor shoe, while forays into other styles haven’t taken hold.” — Bloomberg / Fintool, February 2026. |
The streetwear and lifestyle footwear market that Converse competes in is genuinely large and growing. That’s why Converse sits in Question Mark rather than Dog territory. The market opportunity is real. But Converse’s ability to capture it is increasingly uncertain without significant brand reinvestment and a new product strategy beyond the Chuck Taylor.
Nike laid off Converse employees in early 2026, signaling that a structural reset is underway. Whether Converse moves toward Star territory through reinvention or slides into Dog territory through continued decline will be one of the most important strategic decisions Nike makes in the next two to three years.
b. Nike Digital / Direct-to-Consumer
Nike’s direct-to-consumer (DTC) channel, its own apps, website, and owned retail stores, represents a high-growth market opportunity. E-commerce athletic footwear and apparel are growing globally, and direct sales generate higher margins than wholesale.
But Nike’s DTC share of its own revenue has fallen after the company over-rotated toward DTC between 2020 and 2022 and then had to course-correct by rebuilding wholesale relationships. NIKE Direct revenues fell 13% in fiscal 2025 to $18.8 billion, with digital specifically down 20%.
The DTC channel has the potential to be a long-term Star. Right now, it sits in Question Mark: the market is high-growth, but Nike’s execution and positioning within it is still being recalibrated.
c. Nike Sustainable Footwear
Nike’s sustainability-focused product lines, including the Space Hippie range made from recycled materials and Nike Forward fabric technology, sit firmly in the Question Mark quadrant.
The sustainable athletic footwear market is high-growth: more than 60% of new product launches in athletic footwear now include sustainable or recycled materials.
But Nike’s market share within the sustainable segment specifically is still developing. The investment is real, but the returns are not yet proven at scale.
4. Dogs — Low Growth, Low Market Share
Dogs consume resources without generating meaningful returns. Strategic options include divestment, repositioning, or simply managing for minimal cash drain.
1. Nike SB (Nike Skateboarding)
Nike SB is the most cited example of a Dog in Nike’s BCG matrix. Nike entered the skateboarding market aggressively in the early 2000s. Despite signing prominent skateboarders and launching collaborations, Nike SB never achieved a dominant market share in the skateboarding community, a community that has historically been skeptical of large corporate brands.
Nike SB doesn’t command a primary position within the skateboarding market. It generates limited revenue and limited market growth. Nike briefly paused the line and later relaunched the Nike SB Zoom Stefan Janoski OG to attempt a revival, but the category remains a Dog in terms of strategic contribution.
2. Nike FuelBand / Wearables
Nike’s foray into fitness wearables, the FuelBand activity tracker, is a textbook example of a Dog position. The product failed to compete with established wearable brands and generated modest revenue before being discontinued. Nike has since exited the wearables hardware space, choosing instead to license technology and integrate with partner devices.
3. Older Legacy Apparel Lines
Specific legacy apparel collections that have seen consumer preference shift away from them also fall into Dog territory. Nike’s traditional apparel segments experienced a 3.7% market share decline in 2023, with older athletic shoe collections and apparel lines experiencing negative growth as consumer preferences shift toward newer, innovation-driven designs.
What the BCG Matrix Reveals About Nike’s Strategy
The BCG matrix of Nike tells a clear strategic story. Nike’s core strength, and the source of its $46+ billion revenue base, lies in its Star products: performance footwear, Jordan Brand, and sportswear apparel. These categories hold dominant market share in growing markets and represent the reason Nike commands approximately 27–30% of the global athletic footwear market.
The Cash Cows (equipment, accessories, core basketball footwear, apparel staples) do exactly what Cash Cows should: they fund the rest of the business without demanding heavy reinvestment.
The Question Marks are where Nike’s next decade will be decided. Converse’s continued decline puts it at risk of becoming a Dog if Nike can’t execute a genuine brand reinvention. The DTC channel’s underperformance represents a costly strategic miscalculation that new CEO Elliott Hill is actively correcting. Sustainable footwear remains an unresolved bet.
The Dogs (Nike SB, legacy wearables, fading apparel lines) are relatively contained in their damage. Nike’s size and brand strength mean even underperforming categories are managed without existential consequences.
BCG Matrix Limitations When Applied to Nike
The BCG matrix is a useful starting point, but it has real limitations when applied to a company like Nike.
- It’s static by nature. Markets and competitive dynamics change faster than quadrant positions. Jordan Brand has moved between Star and potential Cash Cow territory multiple times in a decade. Converse shifted from Cash Cow to Question Mark in just two fiscal years.
- Market share is hard to define. Nike competes in dozens of sub-categories like running shoes, basketball footwear, skateboarding, golf, soccer cleats, and lifestyle sneakers, each with different competitive dynamics. A product that is a Dog in one market segment might be a Star in a different one.
- It ignores brand equity. Nike’s biggest strategic asset is not any single product; it’s the brand itself. A BCG matrix doesn’t capture the fact that a Nike-branded Dog product still contributes to brand visibility in a way that a generic competitor’s Dog does not.
- It doesn’t account for portfolio synergies. Jordan Brand’s success lifts the entire Nike footwear business. Converse’s decline has limited spillover damage because the brand is positioned separately. BCG analysis treats products in isolation; Nike’s portfolio operates as an integrated system.
Use the BCG matrix of Nike as a diagnostic framework; a way of asking the right questions about where to invest, where to harvest, and where to exit. But combine it with SWOT analysis, competitive benchmarking, and financial modeling for a complete strategic picture.
Nike BCG Matrix at a Glance
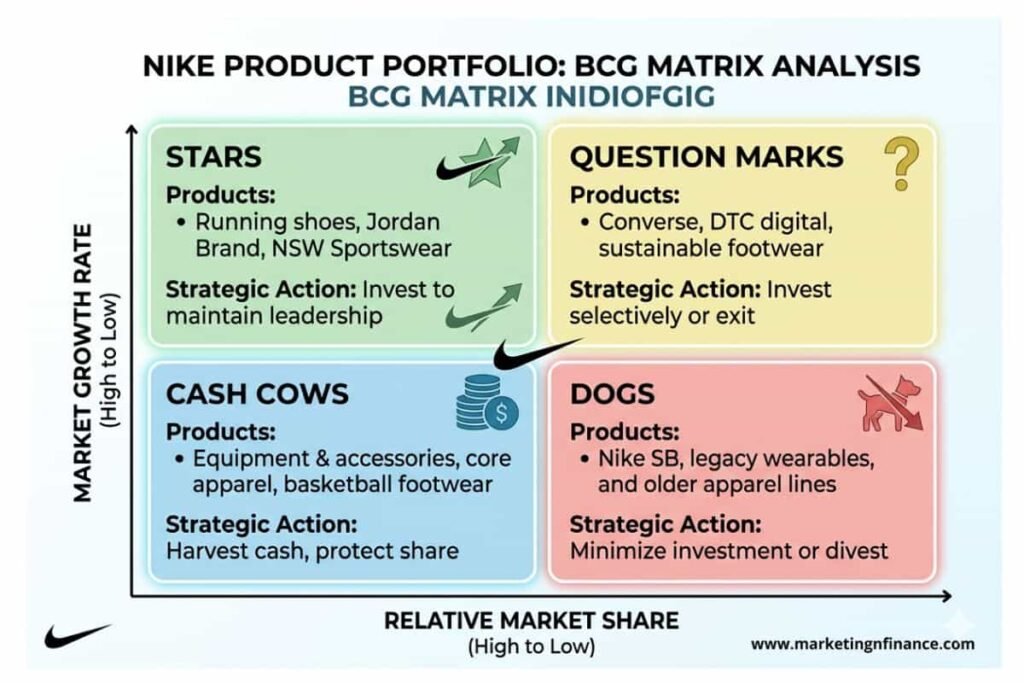
| Quadrant | Products | Strategic action |
| Stars | Running shoes, Jordan Brand, NSW Sportswear | Invest to maintain leadership |
| Cash Cows | Equipment & accessories, core apparel, basketball footwear | Harvest cash, protect share |
| Question Marks | Converse, DTC digital, sustainable footwear | Invest selectively or exit |
| Dogs | Nike SB, legacy wearables, and older apparel lines | Minimize investment or divest |
FAQs: BCG Matrix of Nike
What is the BCG matrix of Nike?
The BCG matrix of Nike is a strategic portfolio analysis that categorizes Nike’s products into four quadrants: Stars, Cash Cows, Question Marks, and Dogs. These are based on each product’s market growth rate and relative market share. It’s used to evaluate which products deserve investment, which should be harvested for profit, and which should be discontinued.
What are Nike’s Star products in the BCG matrix?
Nike’s Stars are its performance running shoes (Air Max, React, VaporMax, Pegasus), Jordan Brand footwear, and its Nike Sportswear (NSW) lifestyle category. These products hold a high market share in growing markets and represent the core of Nike’s competitive strength.
What are Nike’s Cash Cow products?
Nike’s Cash Cows include its equipment and accessories category, core apparel lines, and established basketball footwear. These products generate consistent revenue with low growth but require minimal reinvestment.
Why is Converse a Question Mark in the BCG matrix?
Converse sits in the Question Mark quadrant because it competes in a genuinely large, growing lifestyle footwear market but has failed to maintain or grow its market share. Revenue has declined from $2.4 billion in fiscal 2023 to a projected $1.2 billion run rate in early 2026, driven by over-reliance on the Chuck Taylor All Star and failed product diversification.
What are Nike’s Dog products?
Nike’s Dogs include Nike SB (Nike Skateboarding), discontinued wearables like the FuelBand, and certain legacy apparel lines with declining consumer relevance. These products command low market share in low-growth markets and contribute minimally to Nike’s overall revenue.
How does Jordan Brand fit into the Nike BCG matrix?
Jordan Brand is Nike’s most dynamic BCG element. It sat firmly in the Star quadrant between 2020 and 2024, doubling revenue to reach $7 billion. After a 16% decline in fiscal 2025, it is being repositioned. Long-term, Jordan Brand is expected to return to Star status as Nike’s CEO Elliott Hill — who originally took Jordan Brand international in the late 1990s — leads its recovery.
What is the BCG matrix used for?
The BCG matrix, or growth-share matrix, is used to evaluate a company’s product portfolio and make resource allocation decisions. Products in Star positions receive investment. Cash Cows are managed for margin. Question Marks receive selective investment or are exited. Dogs are candidates for divestment. It was developed by the Boston Consulting Group in 1970.
How does the BCG matrix of Nike differ from its competitors?
Unlike Adidas, which has fewer marquee sub-brands, Nike’s portfolio complexity (Nike brand + Jordan Brand + Converse) creates a three-tier BCG challenge. Each brand requires its own matrix analysis, and the interactions between them, particularly how Jordan Brand supports Nike’s overall basketball positioning. This adds a layer of portfolio synergy that a simple BCG grid doesn’t fully capture.