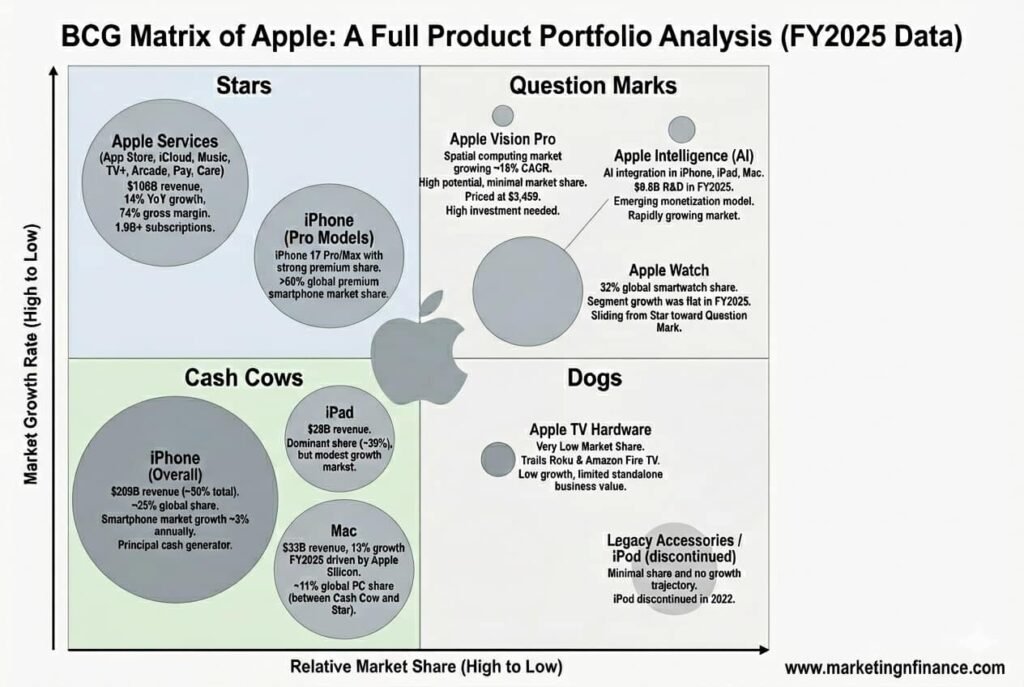
The BCG matrix of Apple maps its key products and services across four quadrants based on market share and growth rate. Apple’s Services segment and iPhone lead the portfolio. Other products, including Vision Pro and Apple Intelligence, are early-stage bets. This analysis breaks down each quadrant using Apple’s latest FY2025 financial data.
What is the BCG Matrix?
The BCG matrix is a strategic framework developed by the Boston Consulting Group in the 1970s. It helps companies decide where to put their resources by sorting products into four categories based on two factors: market share and market growth rate.
The idea is simple. Products with high market share generate cash. Products in high-growth markets need investment. Where a product sits in the matrix tells you whether to invest more, hold steady, milk the profits, or consider moving on.
The Four Quadrants Explained
- Stars: High market share, high market growth. These products are strong performers in fast-growing markets. They need investment to maintain their position, but are on track to become major cash generators.
- Cash Cows: High market share, low market growth. These are the steady earners. The market is not growing fast, but the company holds a dominant position. Profits from Cash Cows fund Stars and Question Marks.
- Question Marks: Low market share, high market growth. These products are in growing markets but have not yet built a strong position. They need significant investment and carry risk. Some become Stars. Others fail.
- Dogs: Low market share, low market growth. These products neither earn much nor have strong prospects. Companies usually divest or phase these out unless they serve a strategic purpose.
Apple Company Overview
Apple was founded in 1976 by Steve Jobs, Steve Wozniak, and Ronald Wayne. From a garage startup making personal computers, it became one of the most valuable companies in history.
Today, Apple designs and sells consumer electronics, software, and digital services. Its product lineup includes the iPhone, iPad, Mac, Apple Watch, AirPods, and Apple TV. Its services include the App Store, iCloud, Apple Music, Apple TV+, Apple Pay, and AppleCare.
In FY2025, Apple generated $416 billion in total revenue, a 6.4% increase from the previous year. The company posted a record net income of $112 billion. With over 2.3 billion active devices worldwide, Apple runs one of the most powerful consumer technology ecosystems on the planet.
BCG Matrix of Apple: Full Analysis
Below is a breakdown of every major Apple product and service, placed in the correct BCG quadrant using current revenue data, market share figures, and growth rate trends.
1. Stars: iPhone and Apple Services
Apple Services is Apple’s clearest Star. The segment covers the App Store, iCloud, Apple Music, Apple TV+, Apple Arcade, Apple Pay, and AppleCare. In FY2025, Services generated $109 billion in revenue, crossing the $100 billion annual threshold for the first time. It grew at 14% year-on-year.
What makes Services a Star is not just the revenue. The gross margin on Services is approximately 73.9%, nearly double the 37.2% margin Apple earns on hardware. Every dollar of Services growth adds far more to Apple’s bottom line than hardware revenue growth. The subscription economy that Services operates in continues to expand at a compound annual growth rate of around 15%, giving Apple both a high share and a high-growth environment.
Apple now has over 1.9 billion paid subscriptions across its ecosystem. That level of recurring revenue is rare even among the world’s largest technology companies.
iPhone Pro models also carry strong Star characteristics at the premium end. The iPhone 17 Pro and Pro Max delivered roughly 12% unit growth year-on-year in FY2025. Apple holds about 68% of its own iPhone segment operating profit from the Pro lineup alone. In the global premium smartphone market (phones priced $1,000 and above), Apple’s share exceeds 60%.
2. Cash Cows: iPhone (overall), iPad, and Mac
iPhone as a whole product line sits in the Cash Cow quadrant. It generated $209 billion in FY2025, accounting for just over 50% of Apple’s total revenue. Apple holds roughly 25% global smartphone market share. However, the global smartphone market only grows at about 3% annually. High share, low market growth: this is the textbook definition of a Cash Cow.
That does not mean the iPhone is declining. It still breaks sales records with each new model. But the smartphone market as a whole is mature. The mass of iPhone cash flow is what funds Apple’s investment in Stars and Question Marks.
iPad is a dominant player in the tablet market with approximately 39% global market share. iPad revenue in FY2025 was $28 billion. The tablet market, however, is not a high-growth category. Upgrade cycles are long, and growth is modest. This puts iPad firmly in Cash Cow territory.
Mac is an interesting case. Mac revenue grew 13% in FY2025 to $33 billion, one of the strongest growth rates in Apple’s hardware portfolio. Apple Silicon, introduced in 2020, gave Mac a clear performance and efficiency advantage over Intel-based competitors. However, Apple’s global PC market share is only around 11%, with Lenovo and HP still well ahead. At current share levels, Mac sits between Cash Cow and Star depending on how you define the competitive benchmark.
3. Question Marks: Apple Vision Pro and Apple Intelligence
Apple Vision Pro is a Question Mark. Announced in 2023 and launched in early 2024, Vision Pro targets the spatial computing market, which Grand View Research projects to grow at an 18% compound annual rate, reaching approximately $90 billion by 2030. Apple currently holds a very small share of this market. The device is priced at $3,499, which limits mass adoption. Apple is investing heavily but has not yet converted its Vision Pro effort into meaningful market share.
Apple Intelligence is also a Question Mark. Apple increased its AI-related R&D spend to $9.8 billion in FY2025, up approximately 55% year-on-year. AI-enabled features are now built into iPhone, iPad, and Mac. Apple holds roughly 38% market share in AI-enabled premium smartphones per IDC Q4 2025 estimates. The market for AI-powered consumer devices is growing rapidly, but Apple’s monetization model for AI is still forming. Question Mark status is appropriate because the potential is high, but the commercial outcome is not yet clear.
Apple Watch deserves a note here. The Watch holds about 32% global smartwatch market share and has over 100 million active devices linked to Apple Health. For most of the last decade, it was a Star. But the overall wearables segment was flat in FY2025 and faces pressure from lower-cost rivals from Xiaomi and Samsung. Apple Watch may be sliding from Star toward Question Mark unless a major product innovation restores segment growth.
4. Dogs: Apple TV Hardware and Legacy Accessories
Apple TV hardware is a Dog. The streaming device market is dominated by Roku and Amazon Fire TV. Apple TV holds a small fraction of that market. High production costs and strong, cheaper competition mean Apple TV is unlikely to become a growth product. Its strategic value today is mostly as an entry point to the Apple ecosystem, not as a standalone business.
The iPod was formally discontinued in May 2022, which was a clear acknowledgment of Dog status. Products no longer manufactured still provide a useful reference point: Apple chose to exit rather than invest, which is the correct BCG-guided decision for a Dog.
Some legacy accessories, including older cable adapters and discontinued AirPort routers, also fall into this category. These products have no meaningful growth trajectory and minimal market share.
BCG Matrix of Apple: Summary Table
The table below maps every major Apple product to its BCG quadrant with supporting rationale based on FY2025 data.
| Product / Segment | Quadrant | Market Share | Rationale |
| Apple Services | Star | High | $109B revenue, 14% YoY growth, 74% gross margin |
| iPhone | Cash Cow | High (~25%) | $209B revenue, but the smartphone market grows ~3% annually |
| iPad | Cash Cow | High (~39%) | Tablet market leader, but a low growth category |
| Mac | Cash Cow / Star | Low (~11%) | $33B, 13% growth FY2025; Apple Silicon driving revival |
| Wearables (Watch + AirPods) | Star / Question Mark | Medium (~32%) | $35B, but overall wearables segment revenue was flat |
| Apple Vision Pro | Question Mark | Very Low | High-growth spatial computing market, minimal Apple share yet |
| Apple Intelligence (AI) | Question Mark | Emerging | $9.8B R&D in FY2025; market share still forming |
| Apple TV hardware | Dog | Very Low | Trails Roku and Amazon Fire TV; low growth and low share |
| Legacy accessories / iPod (discontinued) | Dog | Very Low | No meaningful share or growth; iPod was formally discontinued in 2022 |
Strategic Recommendations Based on the BCG Analysis
A BCG matrix is only useful if it guides action. Here is what the analysis suggests Apple should do with each part of its portfolio.
1. Double down on Services
Services is Apple’s highest-margin, fastest-growing segment. At 74% gross margin and 14% growth, it deserves continued and increasing investment. Apple should keep expanding subscription bundles, adding new services, and deepening iCloud integration. Every new iPhone user who signs up for a paid Apple service improves the long-term economics of the entire business.
2. Milk iPhone cash flows, but keep innovating the Pro line.
The mass-market iPhone is a Cash Cow and should be managed as one. Apple does not need to over-invest in the base model. But the Pro lineup has Star characteristics and justifies continued heavy R&D spending. The A-series chip advancement, camera systems, and Apple Intelligence features on Pro models keep the premium segment growing even as the base market stagnates.
3. Make a decision on Vision Pro within 24 months.
Question Marks consume cash without certainty of return. Apple has historically been disciplined about exiting markets where it cannot win. If spatial computing adoption does not accelerate meaningfully by 2026 or 2027, Apple should consider a significant price reduction, a repositioning as a professional tool, or a scaled-back product roadmap. Continuing at current investment levels without a clear path to market share growth is the wrong strategy for a Question Mark.
4. Let Apple TV hardware fade gracefully.
Investing to grow Apple TV’s share in a market controlled by Amazon and Roku is not a good use of capital. Apple should maintain Apple TV mainly as a software platform and ecosystem connector rather than competing head-on in streaming device hardware.
5. Watch the Mac closely
Mac’s 13% revenue growth in FY2025 is the kind of performance that earns more investment. Apple Silicon genuinely moved Mac’s competitive position. If this growth rate holds over the next two to three years, Mac should be reclassified from Cash Cow to Star in future BCG analyses.
To see how a different company’s portfolio maps across the same quadrants, read our BCG Matrix of Samsung, which compares directly with Apple’s strategic positioning across smartphones, wearables, and consumer electronics.
Frequently Asked Questions
What is the BCG matrix of Apple?
The BCG matrix of Apple maps its product lines across four quadrants based on market share and market growth rate. As of 2026, Stars include Services, Cash Cows include iPhone and iPad, Question Marks include Vision Pro and Apple Intelligence, and Dogs include Apple TV hardware.
Is iPhone a Star or a Cash Cow in Apple’s BCG matrix?
The iPhone is primarily a Cash Cow. It generated $209 billion in FY2025, accounting for 50% of Apple’s total revenue, but the global smartphone market grows at only around 3% annually. High share with low market growth places it in the Cash Cow quadrant.
What are Apple’s Stars in the BCG matrix?
Apple Services is the clearest Star. It generated $109 billion in FY2025, growing 14% year-on-year, with a gross margin of nearly 74%. The subscription economy in which it operates continues to grow at over 15% annually, giving it both a high share and high market growth.
What are Apple’s Question Marks in the BCG matrix?
Apple Vision Pro and Apple Intelligence are the main Question Marks. Both operate in high-growth markets, but Apple holds a small share in each. Apple spent $9.8 billion on AI R&D in FY2025, signaling a serious commitment, but commercial outcomes are still forming.
What are Apple’s Dogs in the BCG matrix?
Apple TV hardware is the clearest Dog. It holds a small fraction of the streaming device market, trailing Roku and Amazon Fire TV. Both market share and growth are low. The iPod, discontinued in 2022, was also a Dog at the time of its exit.
Where does Apple Mac sit in the BCG matrix?
Mac sits between Cash Cow and Star. Revenue grew 13% in FY2025 to $33 billion, which is strong. But the global PC market share is only around 11%, with Lenovo and HP leading the category. Apple Silicon has improved its position, and further growth could push Mac into Star territory.
What is the BCG matrix used for?
The BCG matrix is a strategic planning tool developed by the Boston Consulting Group in the 1970s. It helps companies allocate resources across their product portfolio by showing which products generate cash, which need investment, and which should be phased out.
Is Apple Services a Star or a Cash Cow?
Apple Services is a Star in 2026. It crossed $100 billion in annual revenue for the first time in FY2025 and is growing at 14% year-on-year. Its 74% gross margin is nearly double Apple’s hardware margin, making it the highest-quality growth asset in the company’s portfolio.
Conclusion
The BCG matrix of Apple shows a company in a strong but evolving position. Services has emerged as the portfolio’s dominant Star. iPhone, iPad, and Mac generate the steady cash flows that fund growth. Vision Pro and Apple Intelligence are high-stakes Question Marks that will define Apple’s competitive position in the next decade. Apple TV hardware is a Dog that serves a supporting role in the ecosystem rather than a standalone business.
What makes Apple’s portfolio unusual is how the ecosystem works as a system. Products do not just generate revenue in isolation. Each product pulls users deeper into a network of services and subscriptions that compounds value over time. That is why the BCG matrix, when applied to Apple, needs to be read not just at the product level but at the ecosystem level.
Apple generated $416 billion in FY2025. Net income hit a record $112 billion. The portfolio, for now, is working. The question is what happens when today’s Question Marks mature, and whether Apple can produce a new Star to replace the iPhone’s dominance when that cycle eventually turns.
Related reading: